What are the key factors driving private market performance?
Seven or eight years ago, we were all asking the question: “How will private equity perform once the free money era is over?” Notwithstanding the current drama in the banking sector and the possibility of a further shake-out of private equity-backed companies, investors in private markets are generally taking comfort in the fact that they’ve seen this before. They are taking a risk-on approach to ‘buy the dip’, rather than thinking this could be a falling knife.
A few factors should continue to drive solid performance in private markets for the 2022 and 2023 vintages. In short, these are:
- There are generally conservative carrying valuations for current private equity fund assets, which should mitigate the downside optics of private assets being marked to market at year end.
- There are record levels of dry powder still available and private equity firms are still raising capital, albeit at the lower ends of their forecasts.
- Private equity firms have been focusing on value creation for 12 to 24 months and focusing more on EBITDA metrics than revenue metrics.
With these factors mitigating the headwinds of geopolitics and the uncertainty − even some instability − in financial markets, LPs should increase their focus on due diligence to invest in funds that pick their investments astutely, have conservative valuation policies, and assertively create value. Also, investors should thoroughly understand the terms that govern their investments. In an environment where there is not a rising tide, fees and expense terms can have outsized consequences on performance.
Valuations
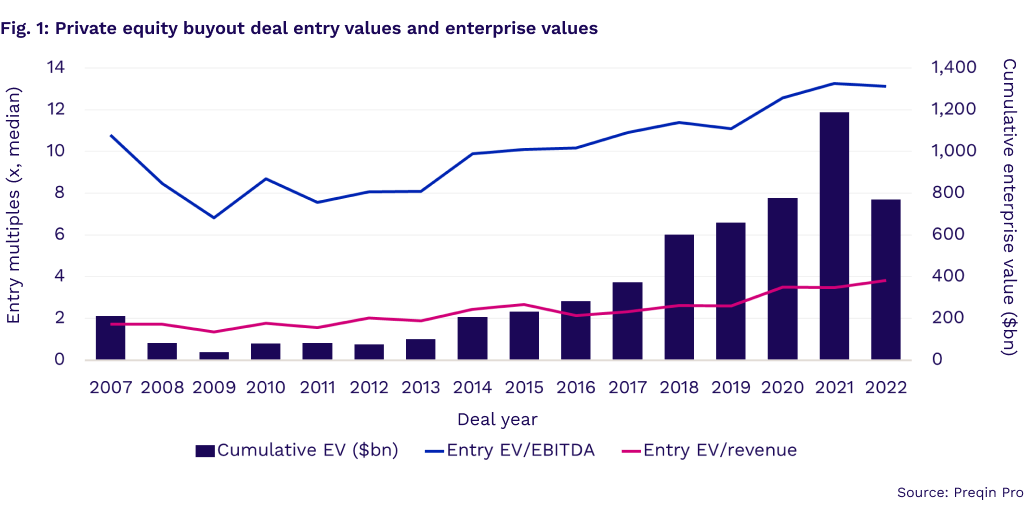
Current cycle deal values likely hit their high-water mark in 2021. During that year, private equity funds and firms enjoyed record revenues driven by management fees from funds raised, as well as carried interest from exits. Yet now sellers will need to adjust their expectations. Data from 2022 shows entry enterprise value/EBITDA multiples falling from 2021 highs, with the median buyout deal costing funds 13.1x earnings, down from 13.3x (Fig. 1). Additionally, we also saw the cumulative enterprise value of these deals fall to near-2020 levels as fewer deals were completed in 2022, year over year.
In the final quarter of 2022, some investors sought liquidity in the secondaries markets to rebalance their portfolios following underperformance in public markets. These transactions produced some anecdotal evidence that we could perhaps expect approximately 20% discounts from third-quarter net asset values in the fourth quarter. While valuations from the fourth quarter are still being finalized at the time of writing (March 2023), we are seeing flat to marginally higher (1–4% on average) enterprise values from the third to the fourth quarter of 2022, based on a random sample of portfolio company carrying values.
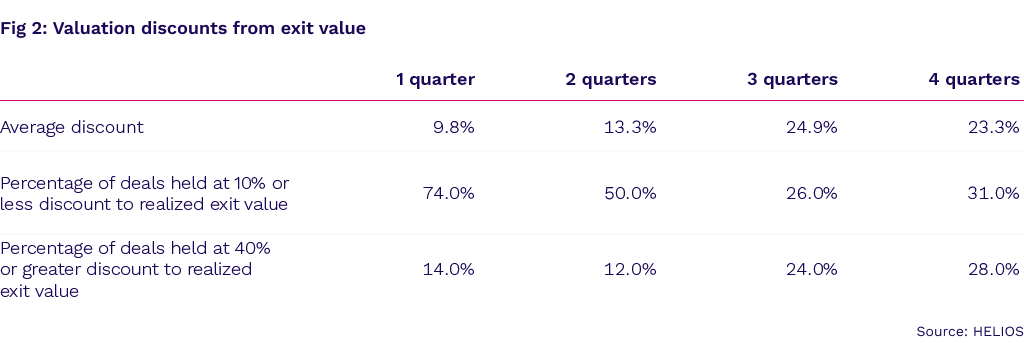
One likely factor supporting this thesis is that a private equity fund is not like a hedge fund, which gets paid on paper gains, so there is no upside to gain from aggressively marking up a private equity portfolio. Many, though not all, firms hold assets at market values significantly less to their ultimate exit values. We can see this in data from Colmore’s HELIOS platform, where the average deal value is typically discounted well below its eventual exit price leading up to sale (Fig. 2).
Fundraising and dry powder
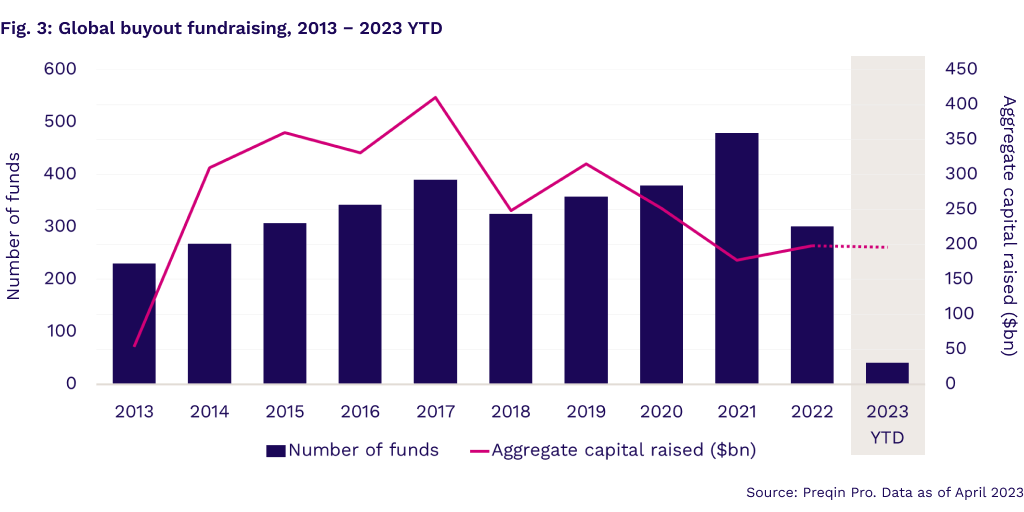
As asset valuations climbed to the stratosphere in 2021, private equity firms were also busy raising record amounts of capital. Consequently, they saw record levels of dry powder build up as the deal market became less attractive, which could limit downside performance as investors look to ‘buy on the dip’. Buyout funds raised $360.3bn in 2021, and while this was less than 2019’s $410.7bn, it’s still the second-best year for fundraising in the last 10 years (Fig. 3). Fundraising in 2022 regressed to the mean, with most of the $309.6bn raised during the first half of the year.
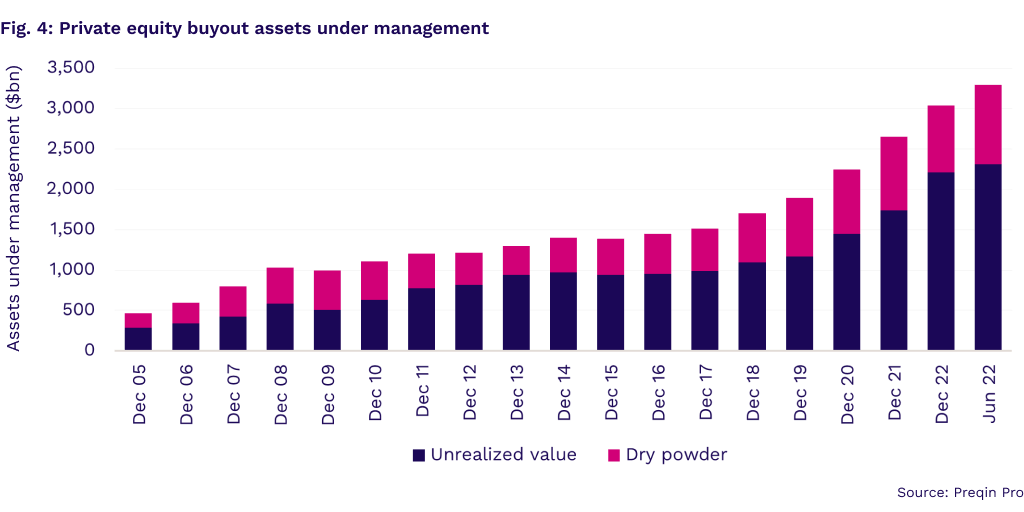
Dry powder reserves grew to $979.3bn in the first half of 2022, as total buyout assets under management (AUM) rose to $2.3tn (Fig. 4). Dry powder’s share of AUM rose to 29.8% of total AUM from just over 27% six months earlier, adding further ammunition for funds to act on downtrodden valuations.
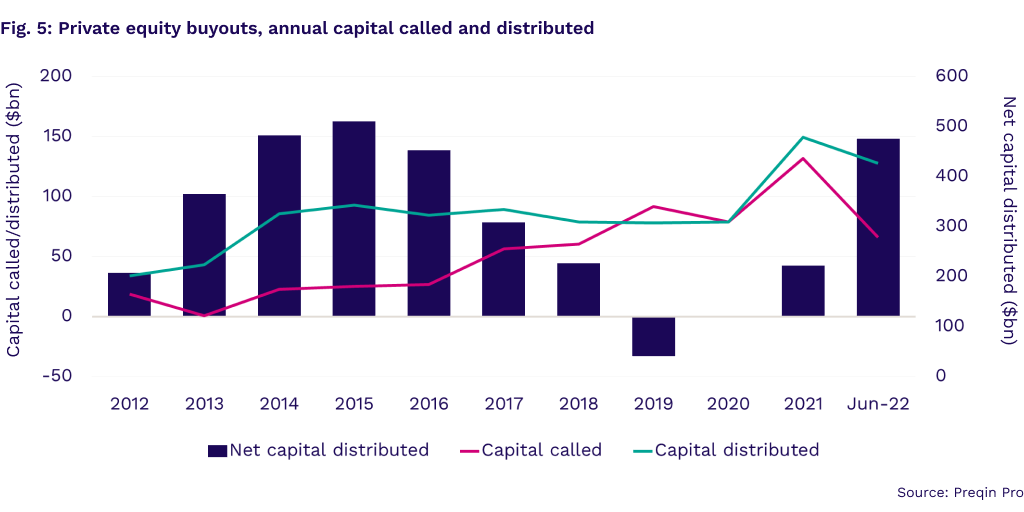
Furthermore, 2021 and 2022 saw the return of net distributions, or capital returned to investors, which they will need to deploy (Fig. 5). However, the rate of this deployment could be lower than in recent years. Many institutional investors are reporting overallocations to private equity, while the denominator effect of lower public equity and debt markets will redirect capital to those asset classes.
Value creation
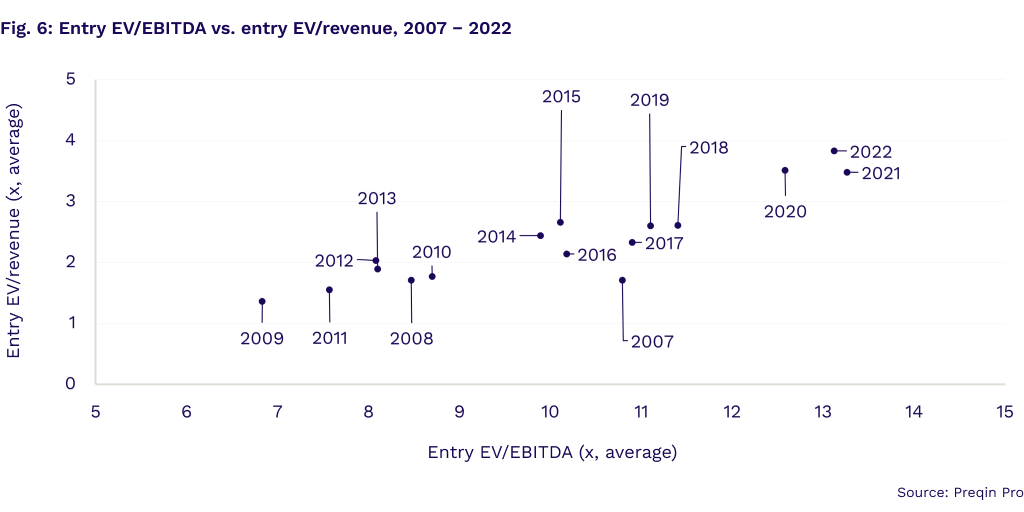
Private equity firms have spent the last two to three years establishing ‘value creation’ roles, potentially as an unintended consequence of the run-up in valuations. These positions have been looking at ways to use digital, talent, and ESG to increase revenue and reduce costs. KPMG focused on these new roles in a 2022 report titled Delivering on the promise of value creation. With this in mind, deal and fund managers are paying more attention to EBITDA metrics for portfolio monitoring, whereas the focus was on revenue and growth at all costs two years ago (Fig. 6).
Due diligence, LP terms, fees, and expenses
Investors also need to understand investment managers’ strategies to capture value in the current market, and understand how fees and expenses are being charged to optimize performance. Economic terms agreed in the limited partnership agreement (LPA) have operational and financial consequences that need to be understood at the point of investment and proactively managed through ongoing due diligence. Put simply, fees and expenses take on increased importance related to performance during ‘non-boom’ periods.
The implication on performance for the 2023 vintage is that there should be ripe opportunities at more reasonable valuations than the previous two to three years to produce average to above-average returns. Manager selection, investment strategy, and investor terms will all have an impact on performance.
Follow Preqin’s Risk Monitor resource page for regular updates in this series.
The opinions and facts included within the above do not constitute investment advice. Professional advice should be sought before making any investment or other decisions. Colmore and Preqin providing the information in this content accepts no liability for any decisions taken in relation to the above.
